
For those jumping into the data world, there can be a significant learning curve. Before getting neck-deep in all of the technical building of databases or datasets for report building, it can help take a step back and document the existing setup and any new plans. Data Modeling is a great way to document how your Database or dataset is currently structured. Having those documents helps you thoroughly plan for any future modifications. The best way to quickly learn about something new is to write out and map all the details about it.
What is Data Modeling?
Data is everywhere. Data is the 1s and 0s stored in Databases and datasets that we use for our projects. We take this information to make daily business decisions for our projects, staff, and use of our time. Before we can take all of the data that we are storing and use it to build helpful and accurate reports, we have to build relationships between the tables storing the numbers, names, and dates. Now this is where Data Modeling comes in. Data Modeling is the process of mapping out where each category of data will be stored. During this process, you can outline the following:
- How many tables you should build
- What the unique identifiers of each table are
- The relationships between the tables
- How many columns each table will have
- What type of data will be stored in each column.
Efficient data modeling decreases load times, increases productivity when using the tool & improves the report’s accuracy. With this, you can make better-informed business decisions.
If a data model is built out poorly, it can lead to duplicate rows in tables, slower load times, and reduced productivity. When a database has redundant rows, there is more to filter through in the table; this increases load time. Even when the requested data is loaded, there is no guarantee it is accurate because databases are not smart enough to weed out the duplicates. Some tools like Power BI can map out the relationships between data tables using automated intelligence. Instead of building the model from scratch, you can go in and make some adjustments here and there. Using Visio allows modeling the data for other tools as well.
Where to Start
Data Modeling can be completed with various tools. A pen and paper work great when all else fails, but there are tools out there built for precisely this purpose to facilitate collaboration, editing, and distribution better. Visio comes with several templates that are ready for you to jump into mapping out your data.
Visio has an extensive list of templates available that are great to kick off a model. We will specifically be working in the Visio app for this blog, but this is not limited to the desktop application. For those of you who are working in Visio Online, you can access these templates too!
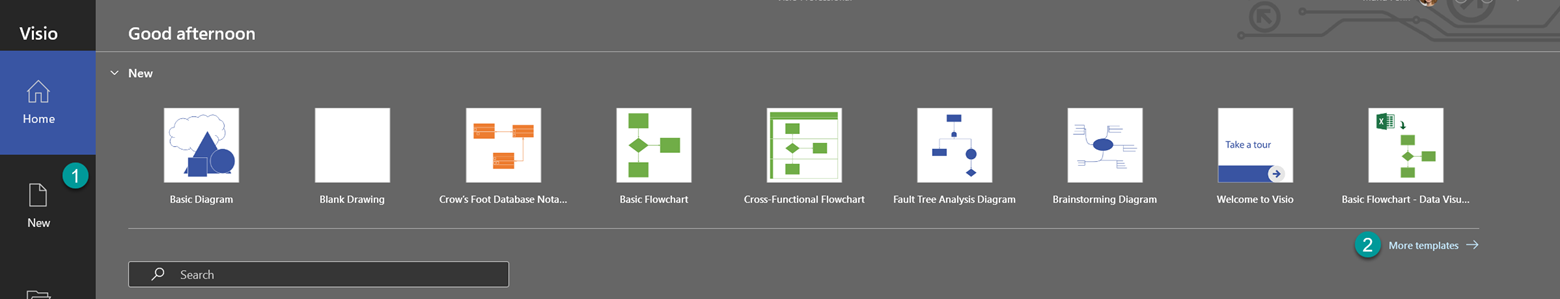
All of the templates in the Visio Desktop App can be located in New. Open the app and immediately, you are given a list of recommended templates. From here, you can either select New or More Templates:
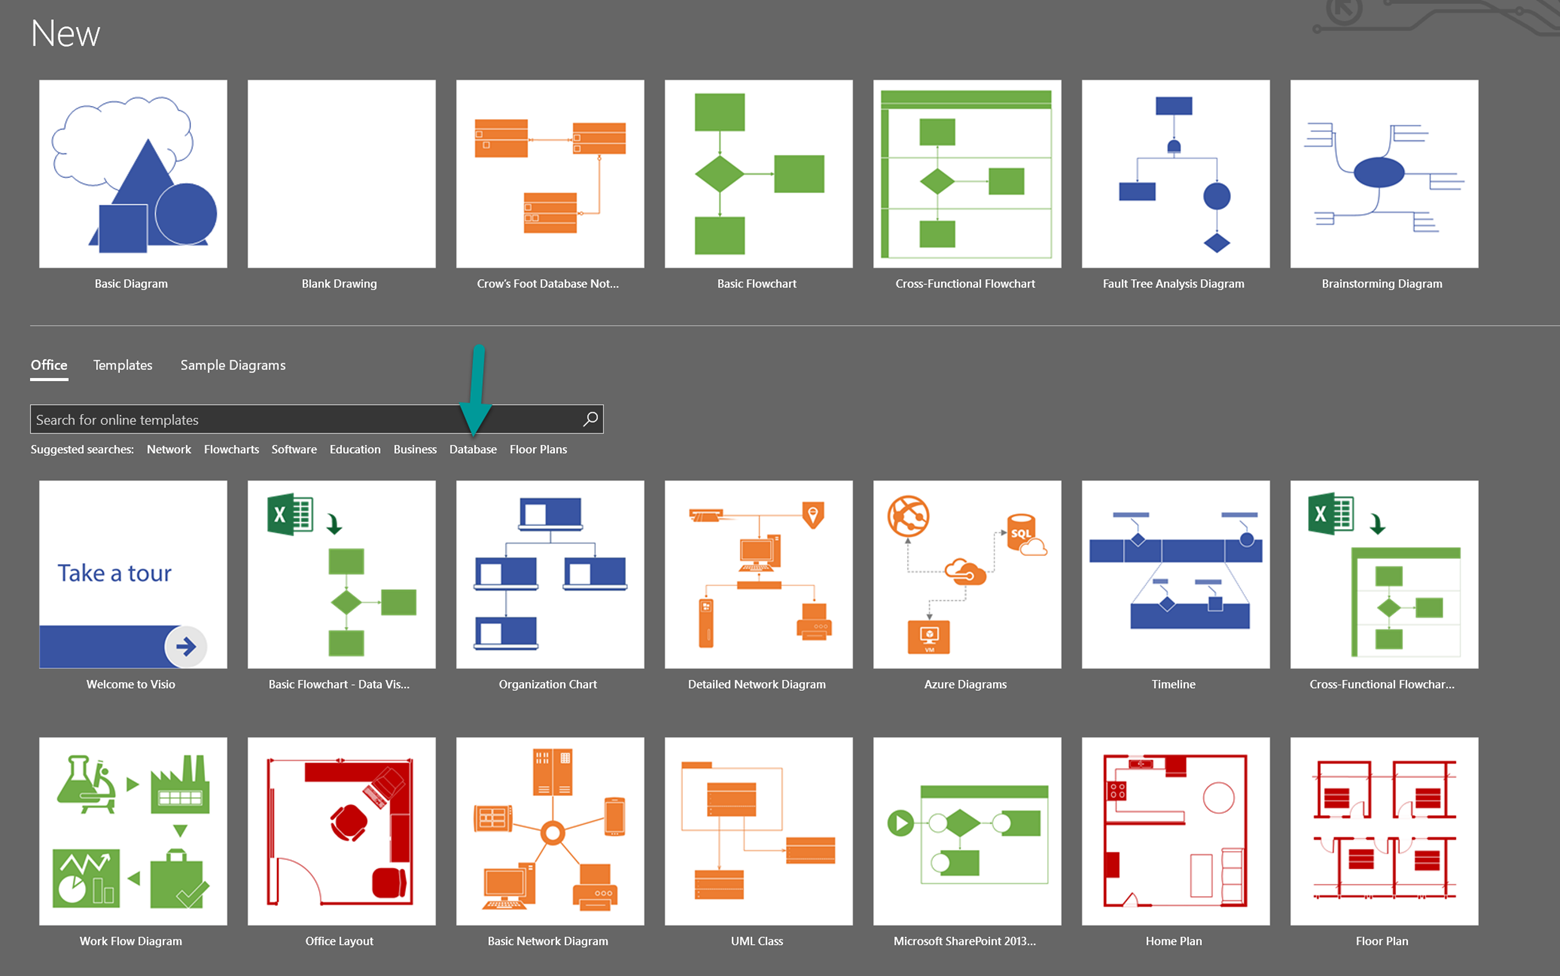
From here, you are given a long list of different available templates. To find the data modeling templates, select Database in the Suggested Searches.
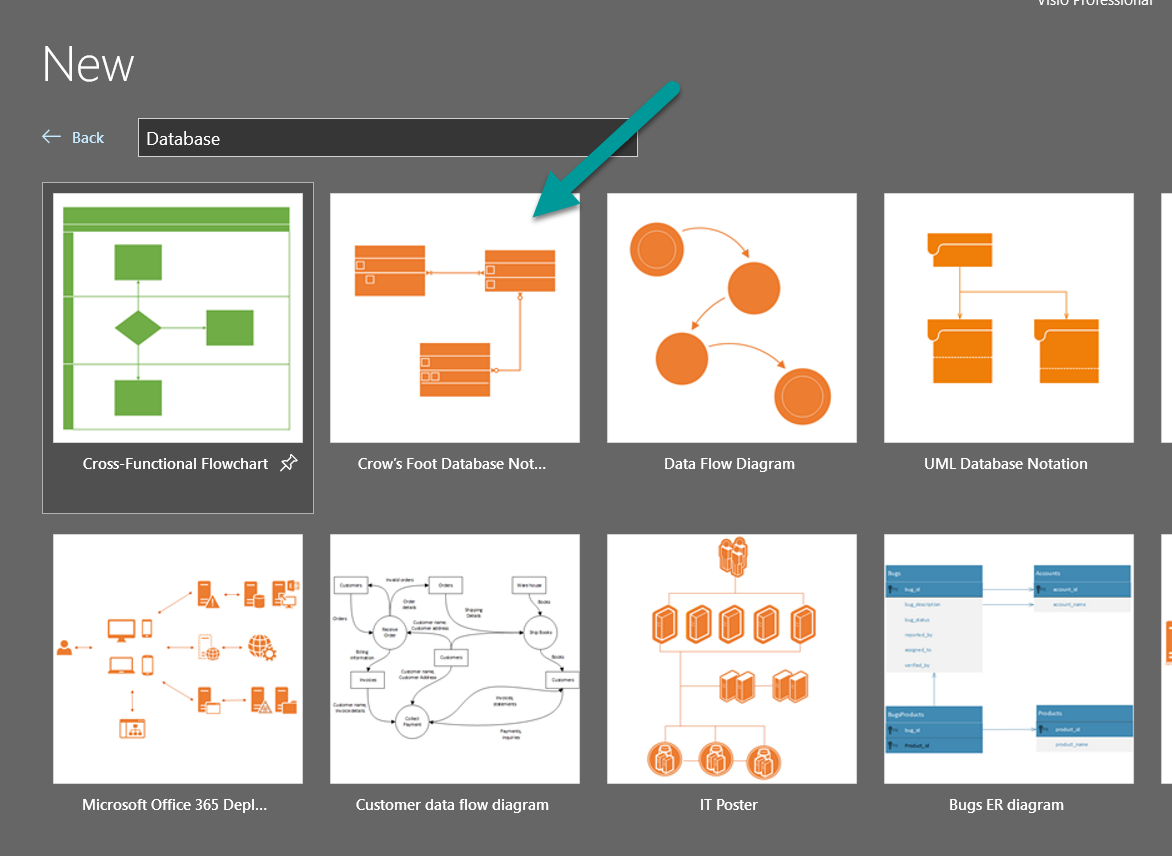
In the Database section, we will focus on the Crows Foot Database Notation.
Crow’s Foot Database Notation
The Crow’s Foot Database Notation template is used to outline a database. It can also be used to map the relationships in the dataset for a report. It has tools that are useful to any new Software Engineer, Business Analyst, or Data Analyst. This diagram maps the relationships between the tables. It can designate whether the relation is one-to-many between the Primary and Foreign Keys, many-to-many, etc. This diagram also provides tools to designate the data type of each column in the table or Entity.
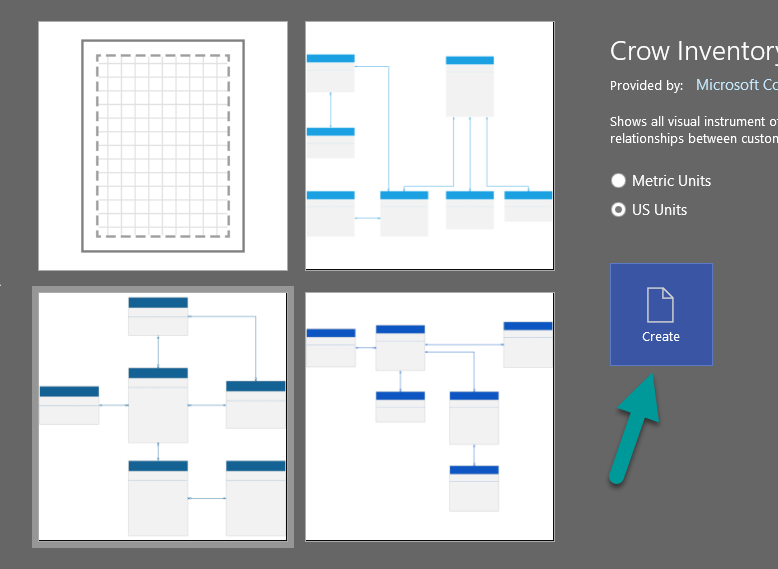
Once you have selected the template we want to use, you will see that a window will open where you can decide if you’re going to start from scratch or if you’re going to use a built-out diagram. Choose the option you feel comfortable with. In this example, we will build out a template to see a basic model that we can work from.
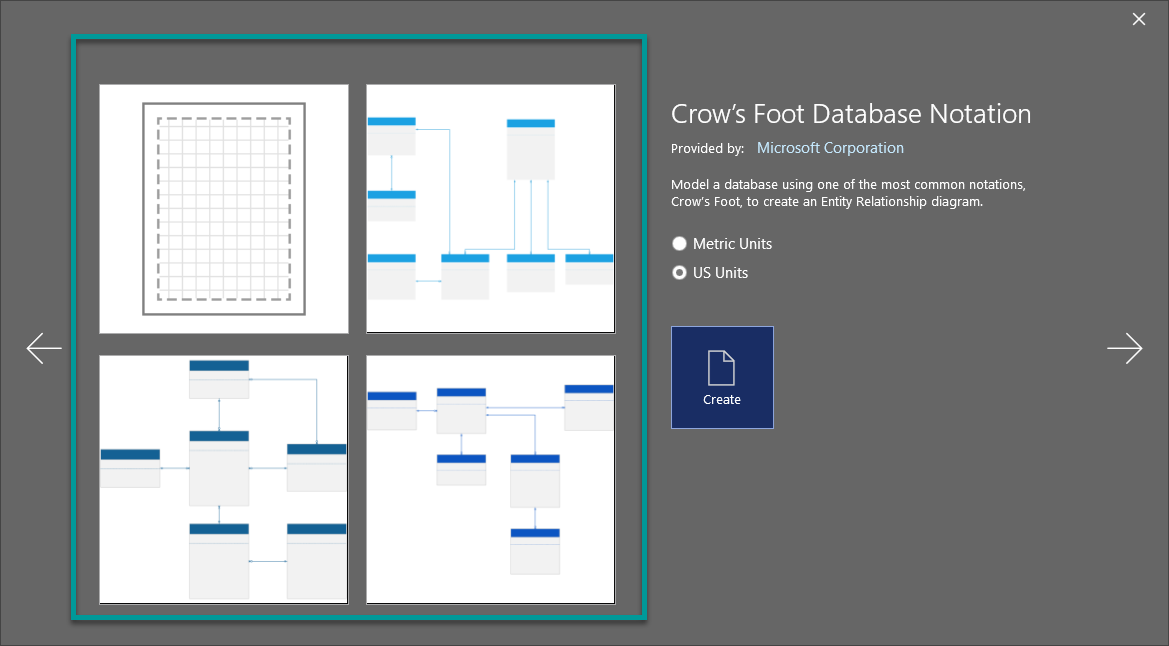
Select Create when you have decided which version of the template you want to use.
When building out your model in this template, there are a few items you need to be familiar with. If you are already familiar with the terms for this notation, go ahead and skip ahead to How to Build the Data Model to learn how to use it in Visio.
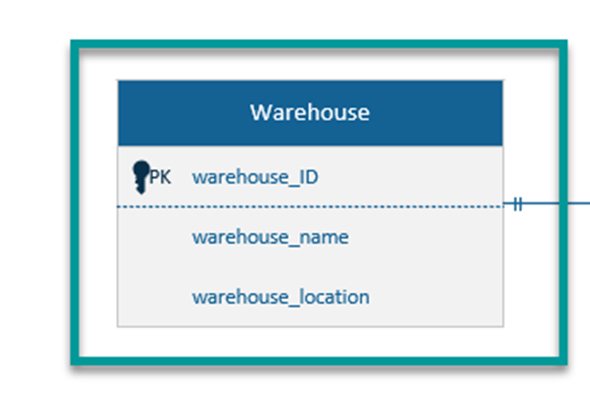
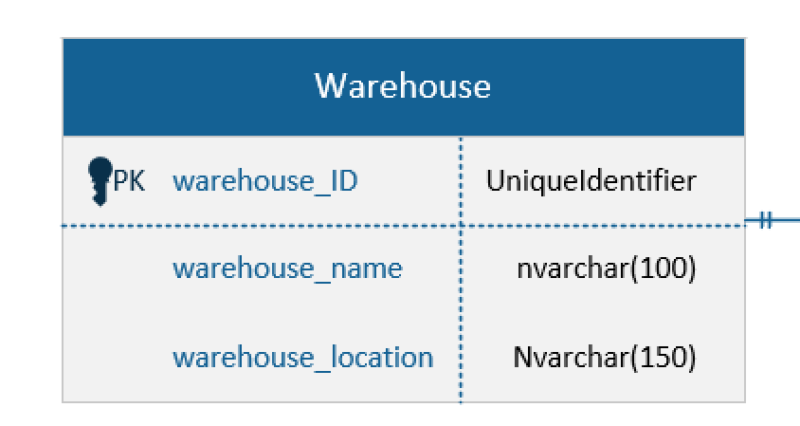
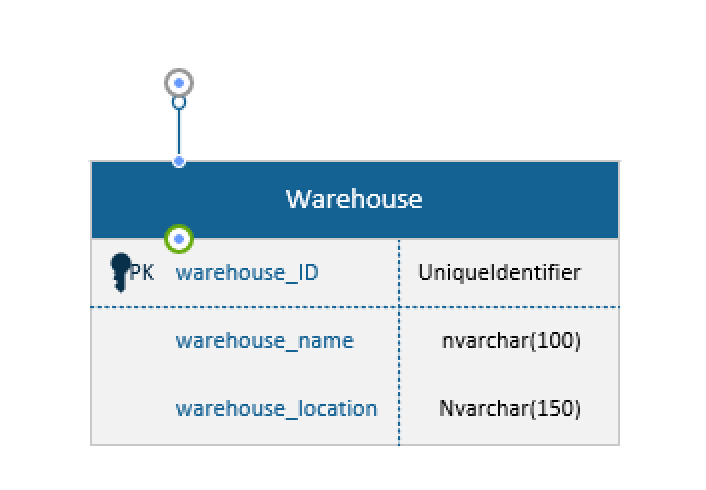
1. Entity: An Entity is a table in the Database or data model. It represents where the data related to the outlined columns will be stored. This could represent a table in a database or even an excel sheet. An Entity is one table.
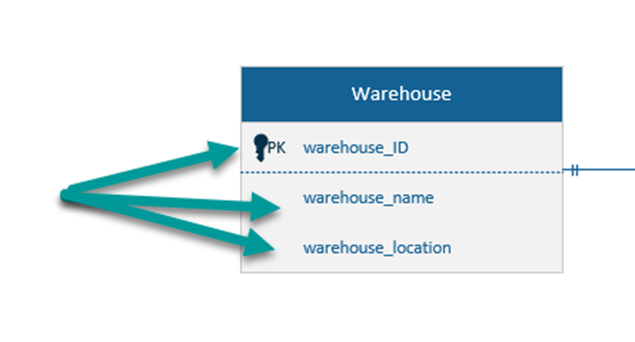
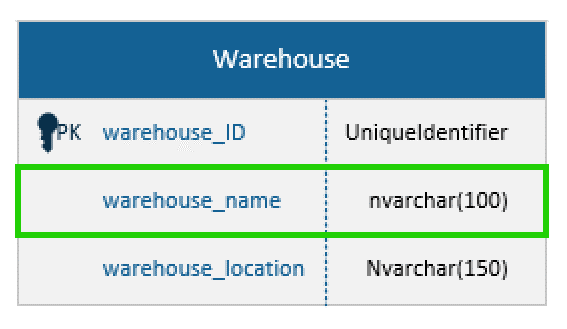
2. Attribute: An attribute is a column in your table. Each item listed in the Entity pictured below is the column name or the Attribute Name.
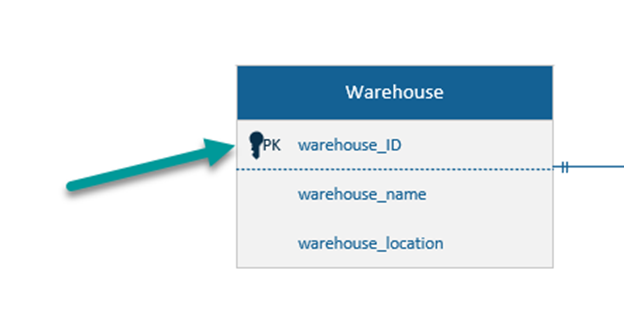
3. Primary Key: The primary key is the ID that is unique to the row in the table. There are multiple warehouses in the example pictured below, but each has a unique ID that can then be referenced in other tables when a relationship is built between them. Primary Keys are always placed at the top of an entity. There is a separator between the Primary Key and other attributes to help the viewer clearly distinguish it from the other columns. A Primary Key can also be designated by the key and PK icon next to it.
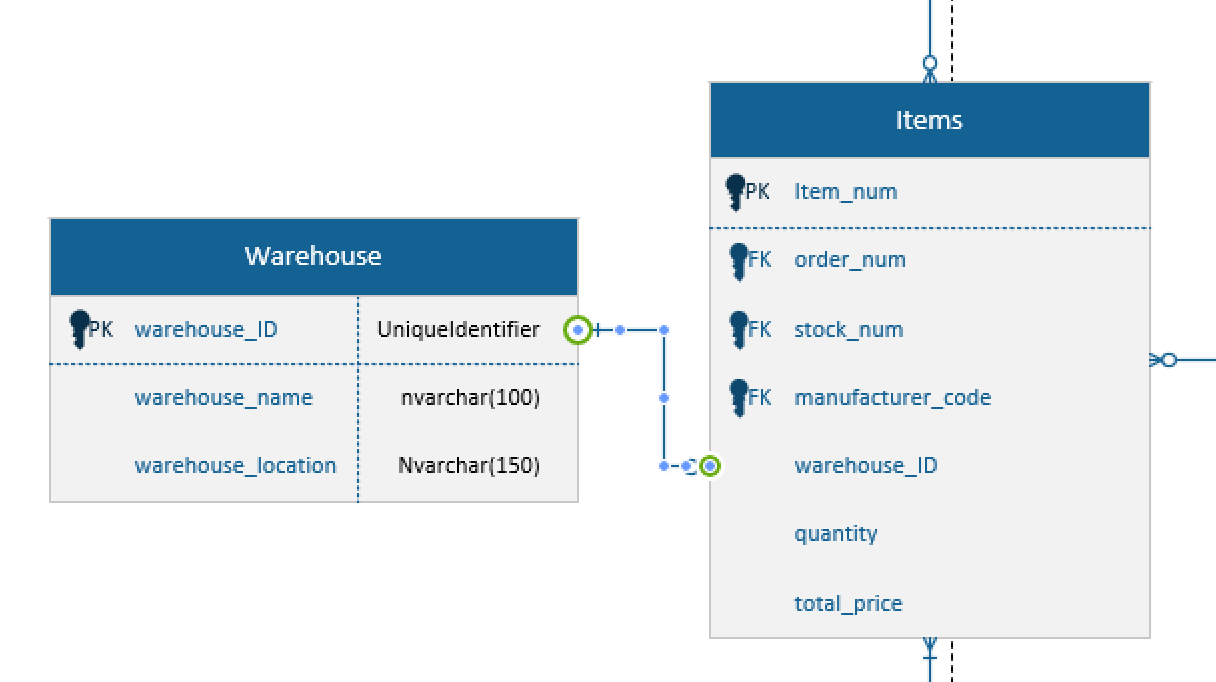
4. Foreign Key: When the Primary Key is listed in another database it is a foreign key. This builds the relationship between tables. A primary key can only be listed once in the table, but a foreign key can be listed in a table multiple times.
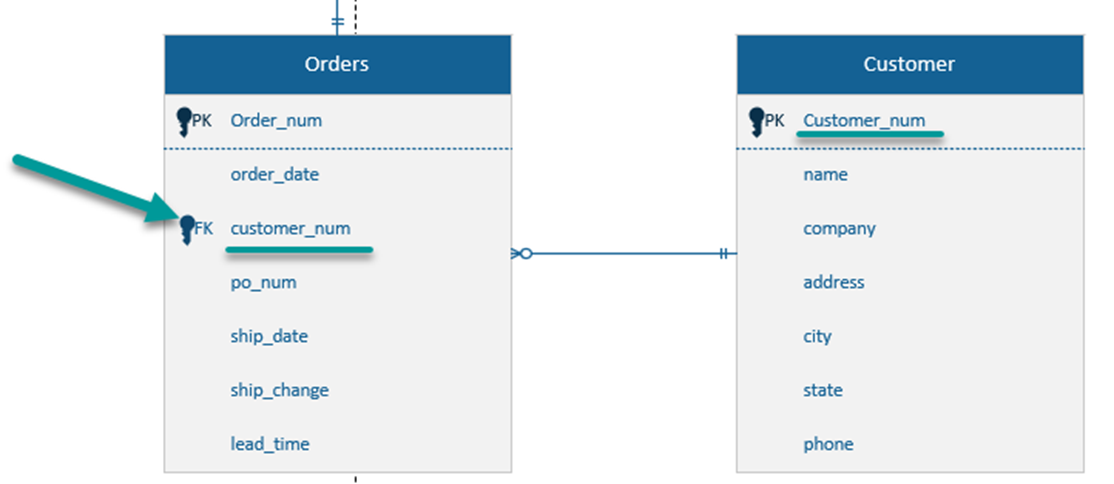
5. Relationships: Relationships are the lines between the entities. A relationship is the connection between the primary key in one table to the foreign key in another table or a foreign key in a table to the same foreign key in a different table/entity.
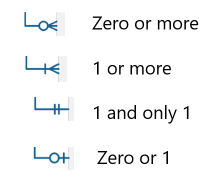
There are three types of relationships in the Crow’s foot notation:
- Zero or more
- 1 or more
- 1 and only 1
- Zero or 1
Using all of these features in the Visio Diagram, you can model your data.
How to Build the Data Model with Visio
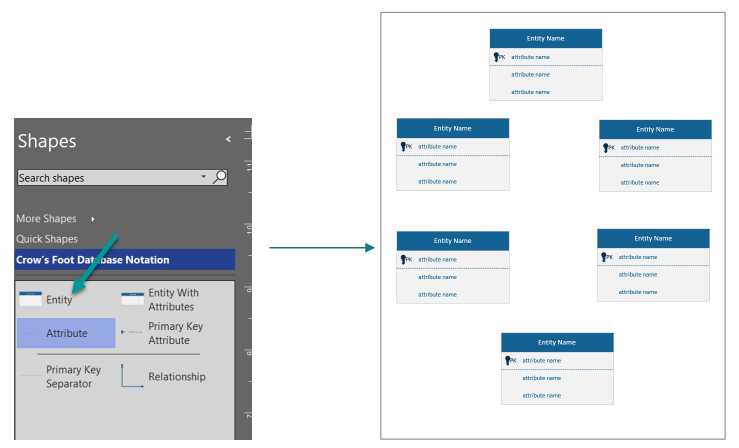
If you chose to start from scratch, begin on the Shapes Panel by dragging and dropping the number of entities you think you will need.
Start with one Entity and outline the columns for a single category of data. For this example, we will start with Warehouses.
When building your data model, it is best to keep names simple and NOT to use spaces. Try and keep your Entity names to a single word whenever possible. If you have to use more than one word, DO NOT USE SPACES. Spaces in your Database can cause potential problems when pulling the data from the table.
An Entity would typically only have one attribute as the primary key. With foreign keys, Entities often have more than one foreign key. Having different entities to separate data by their categories increases the efficiency of the data model. Instead of storing the same details in multiple different Entities, an Entity can reference a foreign key. When a user requests a specific piece of information, the Entity will follow the relationship between the foreign key’s current table and the table where that foreign key is now a primary key. This way, the Database only needs to store the customer name, address, etc., in one Entity.
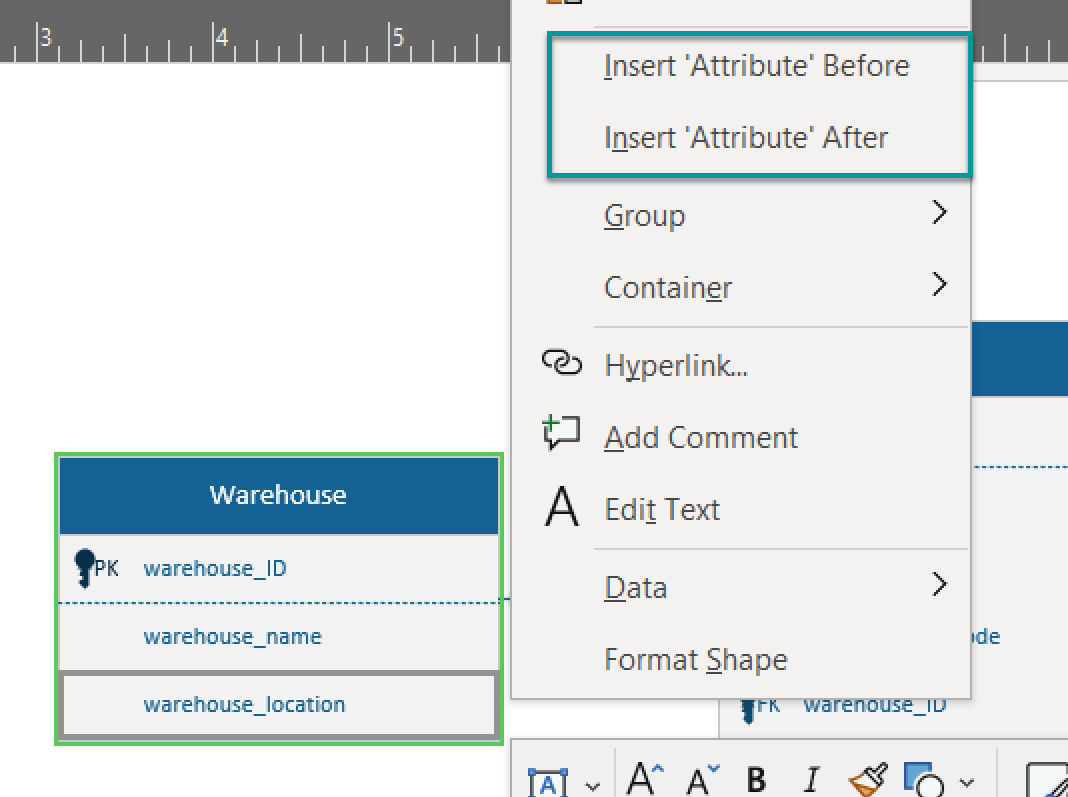
Drag and drop attributes into the Entity as needed. A user can also right-click an attribute to insert one above or below the one selected.
Once you have added all of the attributes to the Entity, right-click the entity box. In the menu of options, select Show Attribute Types.
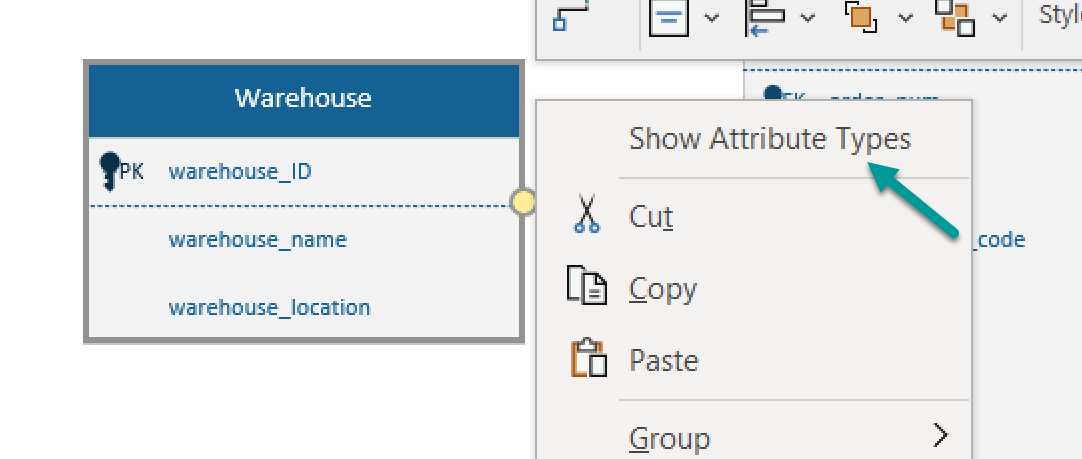
This will add a column to the Entity where the data type can be outlined for each attribute. For more information on data types, see Microsoft’s Summary on Data Types: Data type summary | Microsoft Docs.
Complete this with each Entity. After you have lined out all of the Entities, attributes, and primary keys, it is time to build the relationships between the tables. When building the relationships, you will also be adding the foreign keys to each of the entities. A common identifier connects relationships between tables. When you add a relationship, add the foreign key if it is not already there. Complete the following steps.
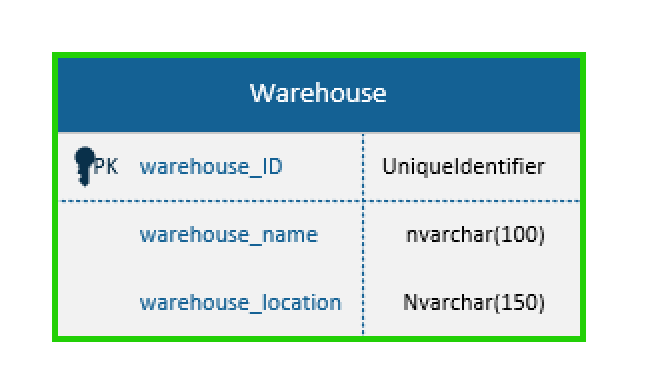
Step 1: Hover your mouse over each of the Entities; you should see a green line around the entire Entity. These are used to connect the tables.
Next, hover your mouse over the attributes, each that you hover over should be encircled by a green line.
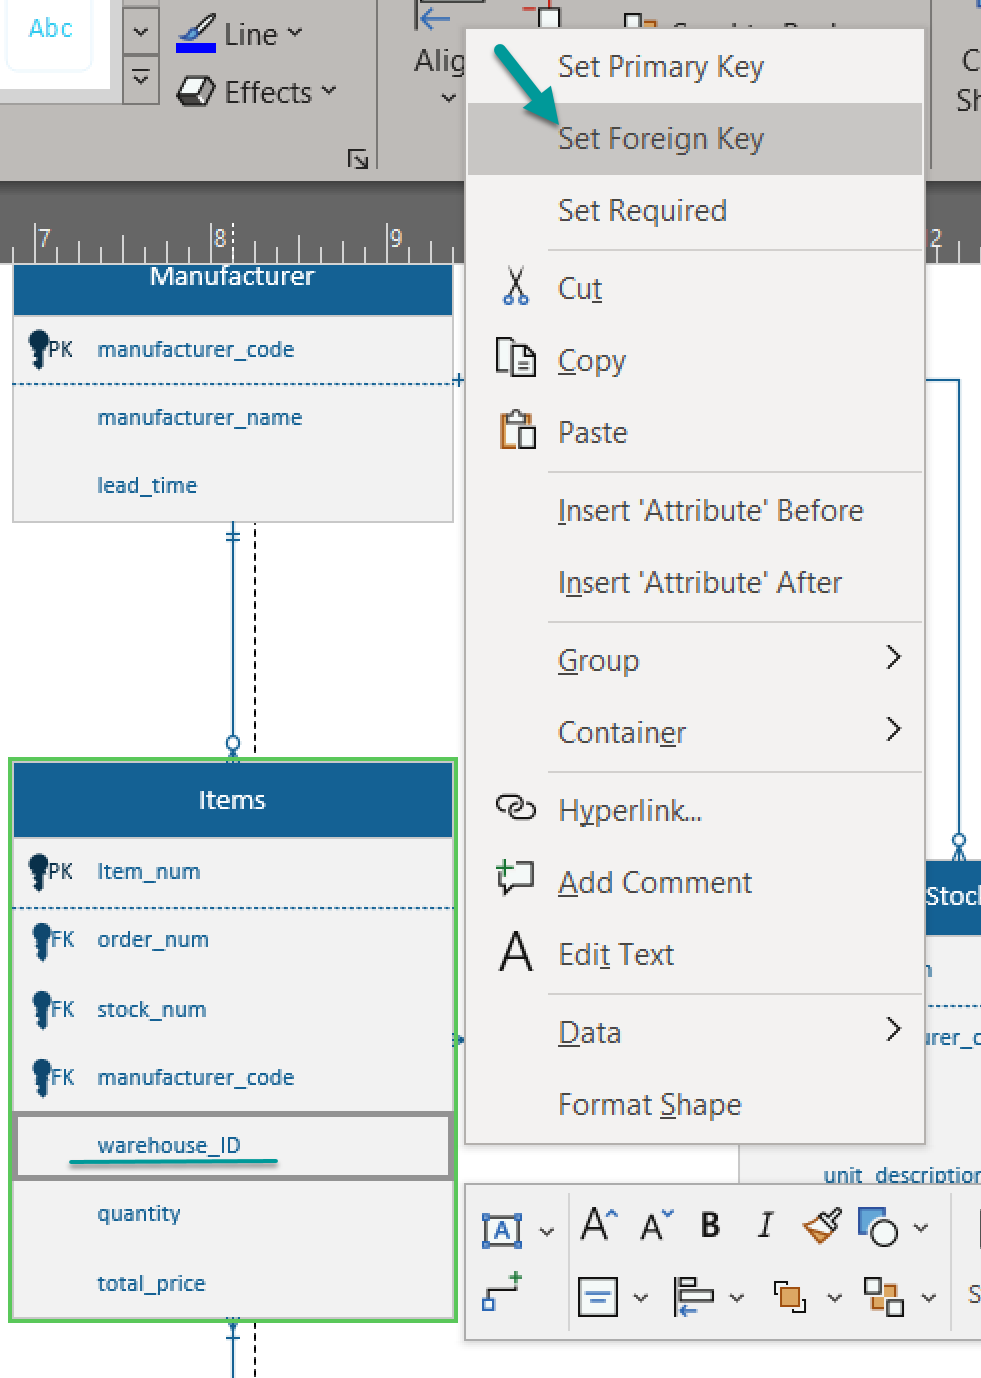
Step 2: Designate the first table you want to build the relationship with. Verify the ID of the first Entity is in the Entity of the receiving table. If it is missing, add it as an attribute—Right-click the attribute and select Set Foreign Key to designate it as a Foreign Key.
Step 3: On the Shape’s Pane, drag over the relationship shape and hover over the primary key of the first Entity.
Select the other side of the relationship and drag it to the receiving Entity’s foreign key. This will create a relationship between the two tables.
Step 4: Right-click the relationship. From here, the user can designate the relationship between the Entities. Choose the correct type of relationship for the beginning and end symbol. The beginning symbol is for the receiving Entity; the end symbol is the starting Entity.
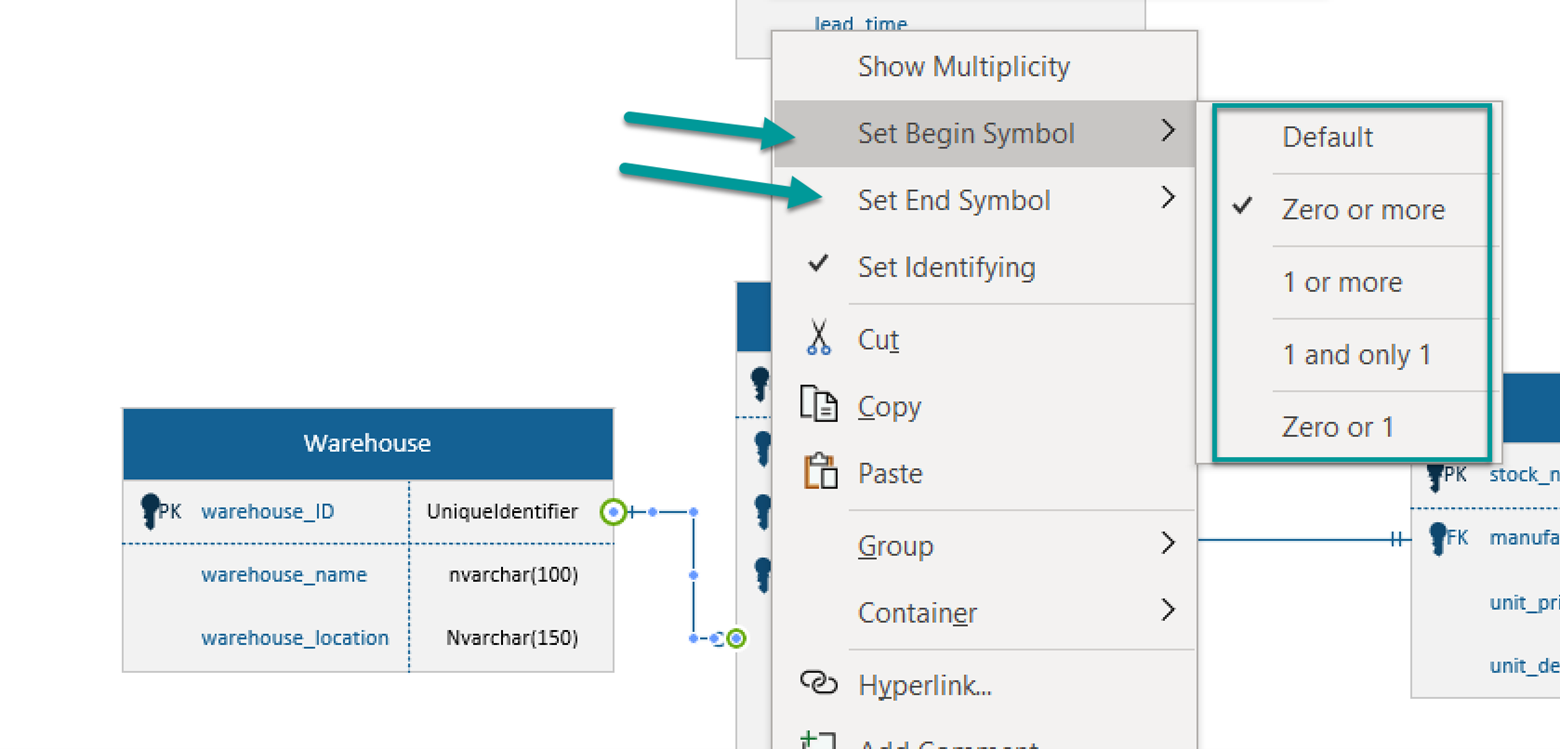
Each option has a corresponding symbol, and the default option is 1 and only 1:
Complete this for all of the required entities.
You have now built a basic data model!
Using these tools, you can continue to add additional complexity to your model. Feel confident that you can understand how your data is structured and share it with others. Using the data model, you have documentation that you can reference to train new users, build reports and potentially troubleshoot your Database. Visio gives a platform that provides each user with the tools and notation they need to build their model.
If you have any other Visio questions or blog requests you can send them to us here. Good luck and happy data modeling!
