Explore the Power BI Service home page
A home page is unique to you and the content and layout changes as you become a more advanced user. In the beginning, it will be simple and additionally offer you helpful tutorial links to the topics most in-demand from beginners. Say your organization has already been using Power BI, you’ll see the most frequently used apps displayed for quick access. If you tag anything as “favorite” or have used it frequently, it will appear at the top of this home canvas. A featured section may appear as well, consisting of items that an administrator has promoted to your landing page.
Furthermore, while the Power BI service is geared toward those who need to view content, not create, you still have the option to design a new report from your home page. Available from the left nav bar at any point, you can import data with the “get data” function.
Using a workspace
Within a workspace, you can collaborate with colleagues on specific content. There are two types of workspaces, my workspace and simply workspaces. My workspace is like your own personal playground for all the content you choose to create. For many Power BI business users, this space will stay empty. Workspaces is the area where compositions that have been shared with you will appear. A workspace is made up of an array of content. For instance, within a workspace, your content is separated by type: dashboards and reports. Sometimes you might also have workbooks and datasets.
Accessing a workspace is different user-to-user, depending on the specific permission that the designer assigned you. You can be a Viewer, Member, Contributor, or Admin. Typically, only the designer will act as the admin. The Viewer role is the safest for a business user to take on. With safeguards in place, there’s no risk of you messing the underlying dataset. A load off any business user’s mind!
Using a dashboard
A dashboard is a gateway into the lifecycle and processes within your company. As a bird’s eye view into the current state of the business, you’re able to gain a large number of quick insights from this high-use area. The canvas will always be a single-page containing visualizations that tell a story when properly combined. Each visualization is its own tile. A great feature within a dashboard: when you’re waiting for certain conditions to be met in the data, you can set up alerts, and the service will automatically generate an email to you when the stars align.
As a side note, your Power BI licensing must be “Pro” or “Premium” to access a dashboard someone has shared with you. While we’re not going to dive into licensing in this particular post, you can learn more here.
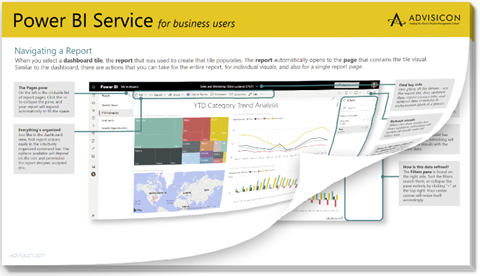
Navigating to a report
When you select a visualization tile in a dashboard, the report that was used to create that tile appears. The report will automatically open to the page that contains the tile visual. While a report contains multiple pages, it’s only built off a single dataset. Conveniently, you can see the dataset’s tables, fields, and values from here. Within a report, there are many ways to filter, highlight, and slice data—functions that are not all found in a dashboard.
Advantages of apps in Power BI
When dealing with various workspaces and reports, it can become messy and complicated to try to locate all your related information. Luckily for business users, creators can first create the dashboards and reports and then package them together into an app! The app designer can share the link to the app with you directly or publish the app to the Power BI Service where you can access it. Since related dashboards and reports are found within a single app, it’s easy for you to find and install the intelligence you need.
Ask questions of data
One of the best features of Power BI is the ability to ask questions of your data using natural language. Make no mistake, this is not a search bar utilizing keywords. Anywhere you see a field prompting you to “Ask a question about your data,” you can type in your query. For example, say you enter “how many new customers did we gain last year?” You’ll get your answer in the form of charts and graphs.
Q&A will automatically select the visualization that is best suited to the data, however, if you’re looking for a certain type of visual, let’s say a line chart, you can add that to your question. A quick caveat, the data you’re looking for might not be available in the type of visual you specify. Simply remove your visual type from the question to allow the program to access more options.
It’s essential to note that this is an advanced feature requiring a Pro or Premium Power BI license.
Power BI on all your devices
While this guide focuses on the Power BI Service experience in a traditional web browser, keep in mind that you can also use a mobile device to view your information. Microsoft makes sure the viewing experience is superior. Everything is beautifully optimized for viewing on your device of choice. Available no matter the brand of your gadget, this gives you visibility into your information regardless of if you’re in the office or working from home—just add wifi!
If you have any questions about using Power BI service as a business user or want to get started diving into report creation, you’ve come to the right place. We’re happy to help you here at Advisicion. Reach out today to get the answers you seek!