Strengthen Your BI Implementation Strategy with These Key Targets

So, you’ve decided it’s time to stop compiling manual reports and tracking KPIs across multiple applications. You’re ready to build a business intelligence (BI) implementation strategy.

Choosing the right technology and implementing a software platform is not enough to realize a return on investment. This strategy is your blueprint for deciding how to use data in your company.

To create a strategy, you must determine three things. How will you deploy the software platform? How will you manage the data for analysis? And how will you enable your people to make informed, data-driven decisions?

Rather than diving into the implementation by applying broad BI strokes, begin the process by gathering requirements and establishing a personalized understanding of the data analytics needs.

The BI strategy requirements-gathering process has two key targets: business strategy and end-user requirements.

Business Strategy Alignment Requirements

Good BI integrates what is needed by a given organization, diving into the business to build reports and create formulas that meet the unique needs of the situation. This process of clarification is often referred to as “business alignment.”

Although the process may seem tedious at times, don’t underestimate it—this new understanding of your business needs can unlock unforeseen capabilities.

Consider the “line of sight” technique

This technique aims to help reveal the context of data use and its purpose and is based on the concept that, without context, data cannot be viewed or used correctly.

Here are the steps to accomplishing high-level alignment:

1. Understand your business strategy

Although there has likely been strategic planning occurring in the business, is there actually a documented strategy?

If so, pick apart the document to find key areas where analytics may be delivered. If there isn’t a document, now is the time to put one together.

While it can take a long time and multiple contributors to create a strategy that everyone agrees on, try asking concise questions about how the organization works right now.

  • Do you compete or collaborate with competitors?
  • Do you protect innovations or go to market quickly?

After answering these questions, you can sort your strategy into one of four categories:

  • Intellectual Property Strategy—Collaborate and protect.
  • Disruption Strategy—Compete and go to market quickly.
  • Value Chain Strategy—Collaborate and go to market quickly.
  • Architectural—Compete and protect.

For more information on business strategy, this Harvard Business Review article offers more insight.

When looking to understand strategy, make sure to note any key goals or KPIs. Sales numbers, client numbers, lead numbers, or the like.

2. Analyze your strategy

Next, determine how data will be used to help you meet your strategic goals. Your BI goals should meet your business needs, not merely desires or dreams for your company (although those are vital to the vision and funnel through into business needs).

3. Examine data usage thoroughly

Look at each component of your data usage, including elements, metrics, dimensions, values, and lists. Data requirements can be expressed as a metric, fact, or a contributor to a metric or a fact. All of this helps to maintain focus on a business context.

4. Observe patterns

Look over the way you use information. Are you using analytics to the most effective degree or working with effective BI? Either or a combination of both can further refine your implementation needs.

Break down your strategy into assessable segments. Look at each data element and ask if it fulfills a particular purpose or capability or if it potentially could.

Then consider:

  • Examining business objectives: What cycles can you measure? Customers, product development, and high and low cycle times could all be measured and accounted for.
  • Gauging what it will take to achieve your measurable goals: How can data help you achieve what you set out to?
  • Working actively with metrics: Complete data analysis, using metrics and algorithms to understand buying patterns, etc.
  • Analyzing what you find: Look at all data elements, dimension value ranges, and algorithmic results.
  • Grouping KPIs, Metrics, and BIRs: Make sure you can organize this data and assess it for technical requirements.

Grab your free Power BI Quick Start Guide

Download the Business Users edition featuring workspaces, dashboards, and reports.

By registering, you confirm that you accept our Terms and Conditions and Privacy Policy.

End User Requirements

Before launching a business intelligence application, make it a point to get end-user’s input and ascertain their needs. Gathering these requirements and baseline information helps to avoid confusion and problems down the road.

A common pitfall here is that often, the questions assume a level of familiarity with BI that the users may not possess, leading to misunderstandings and answers that aren’t truly beneficial.

To be safe, ask a series of basic questions designed to inform as to who you are working with and what business intelligence capabilities you need to provide them with. There are four questions we recommend asking end users.

1. How familiar are you with Excel and its features?
Many people have an inaccurate or overblown perception of just how sophisticated their tech knowledge is, so don’t bother asking, “at what level are your technical skills?” If someone has a relatively complete working knowledge of Excel, able to create formulas and interpret numbers, they’re likely to be able to utilize BI.

2. How much time can you spare to find and analyze information?
Usually, people need to access information, but very limited time to accomplish the task. If they have zero time, they’re not actually a BI end user. A business intelligence tool is for those whose positions in their organization grant them the time to use it—analysts, for instance, rather than executives.

3. What sort of questions do you need to be answered?
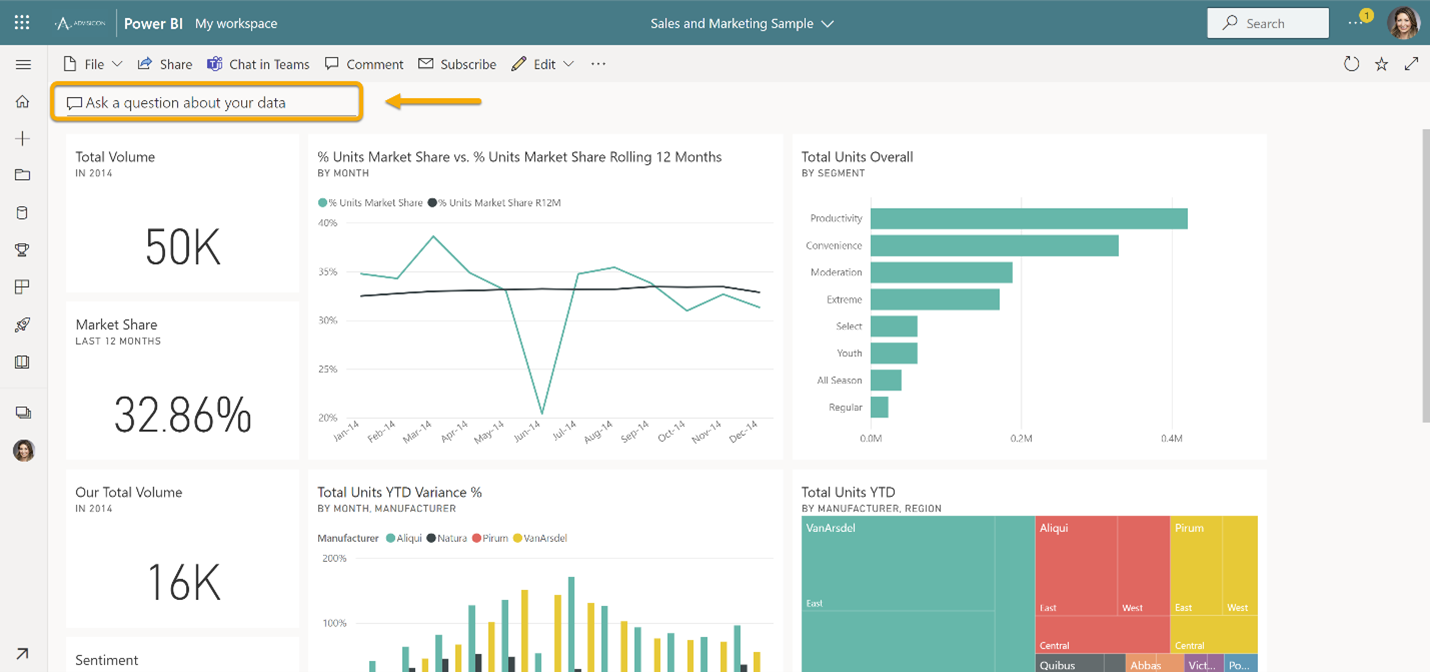
Knowing this is essential to know how to help users. For example, if the user wants to ask spontaneous, random questions, they need ad hoc query tools. If the user wants to keep tabs on the status of a key metric, they need scorecards or dashboards to track performance. Some applications offer both. Power BI, for instance, features a natural language Q&A feature within dashboards and reports.

4. What sort of time frame is your data contingent upon?

There are three levels of time demands related to business intelligence.

  • Real-time data is used to monitor front-line operational processes. Information is displayed and updated concurrently with an ongoing business event. This dictates the use of dashboards and reports.
  • A scheduled update means data is updated on a set basis—once a day, every other hour, etc. Most BI deployments are quite compatible with scheduled updates in one form or another.
  • On-demand updates cover instances when the user needs to access information held in a near-real-time data warehouse directly. In these situations, good BI deployment methods include reports and dashboards, as well as guided and ad-hoc reports.

Wrapping it up

Assessing the business aspects and personnel aspects of a BI implementation are two sides of a coin: the bottom line and the people. Understanding both is crucial to successfully put a strategy into place.

The more you understand what your real business needs are, the better you can harness the power of data to meet them.

Contact Advisicon today for more information and in-house training on how to better align your needs to your BI reports!